A GPU can look “fine” on the surface while silently underperforming due to overheating, driver instability, VRAM issues, or power limits. If your games suddenly feel stuttery, benchmarks seem low, or FPS drops appear out of nowhere, it’s time to properly test your graphics card.
This guide is part of our broader technical gaming resource inside The Ultimate Gaming Guide Hub, where we break down FPS optimization, PC performance, and hardware troubleshooting for gamers in 2026.
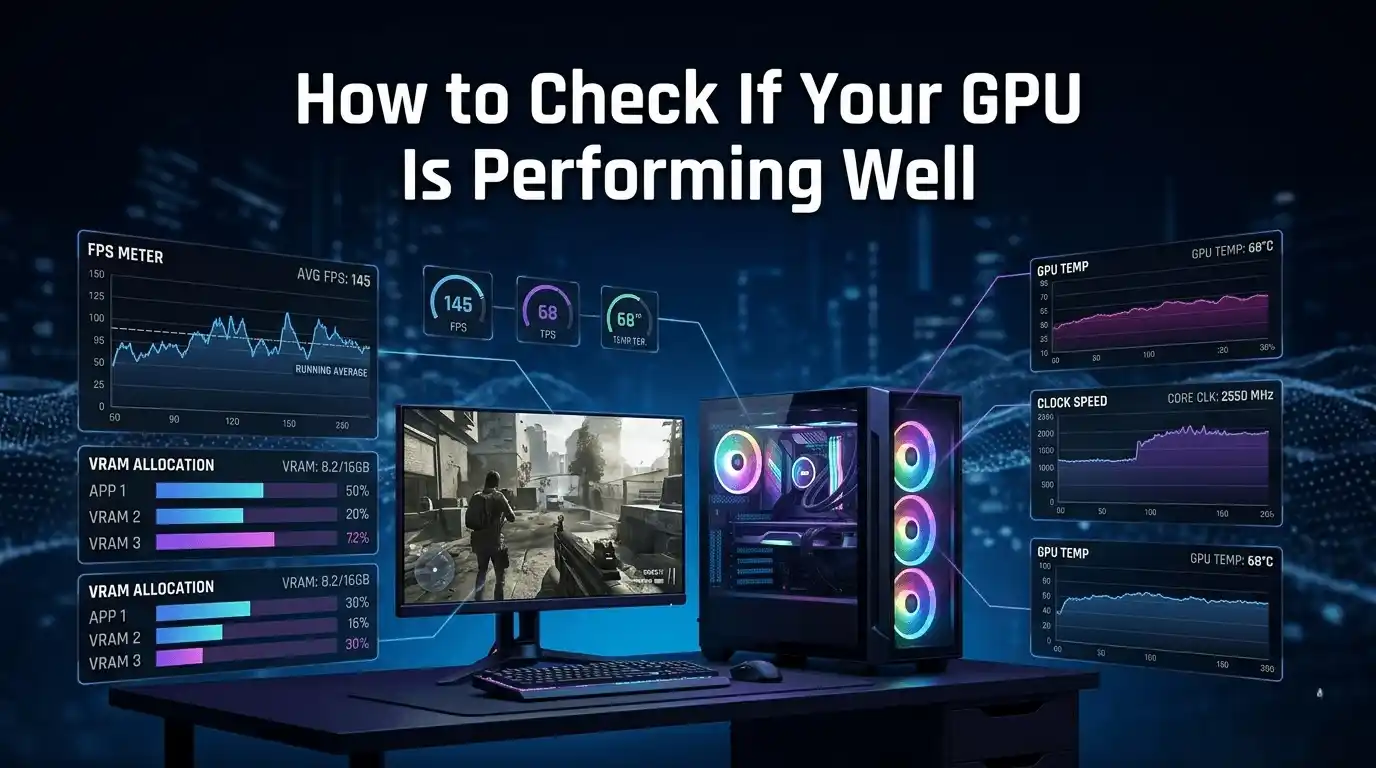
This guide explains how to check if your GPU is performing well using real-world monitoring tools, stress tests, benchmark comparisons, and FPS analysis. Whether you’re on Windows 10, Windows 11, Ubuntu, or a gaming laptop, you’ll learn how to measure GPU health, stability, temperatures, and gaming performance accurately.
What Does “GPU Performing Well” Actually Mean?
GPU performance is often misunderstood, especially when compared with overall system performance factors like CPU limits and RAM efficiency, which we also explain in guides such as What PC Parts Affect Gaming the Most? (Complete FPS Performance Guide) and Does RAM Affect FPS in Games?
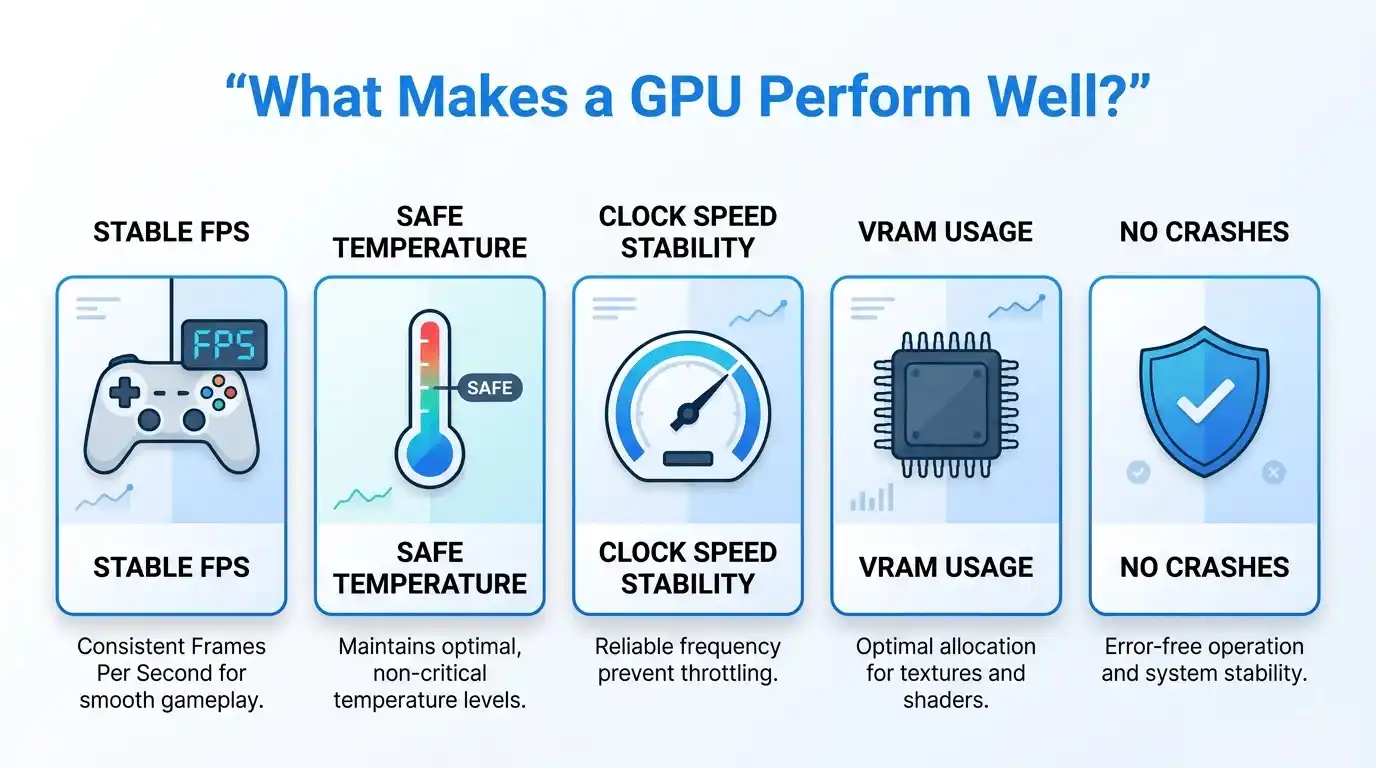
A healthy GPU should deliver:
- Stable FPS output in games
- Consistent clock speeds under load
- Safe temperatures without thermal throttling
- No visual artifacts or crashes
- Proper VRAM utilization
- Reliable driver behavior
The most important GPU performance metrics include:
| Metric | What It Tells You |
| GPU Utilization | How much of the GPU is being used |
| Temperature | Cooling efficiency and thermal health |
| Clock Speeds | Whether boost frequencies are maintained |
| VRAM Usage | Memory pressure during gaming |
| FPS (Frames Per Second) | Actual gaming performance |
These checks apply to:
- Windows 10
- Windows 11
- Gaming laptops
- Ubuntu/Linux systems
- Dedicated and integrated GPUs
How to Check Your GPU (Quick System Detection First)
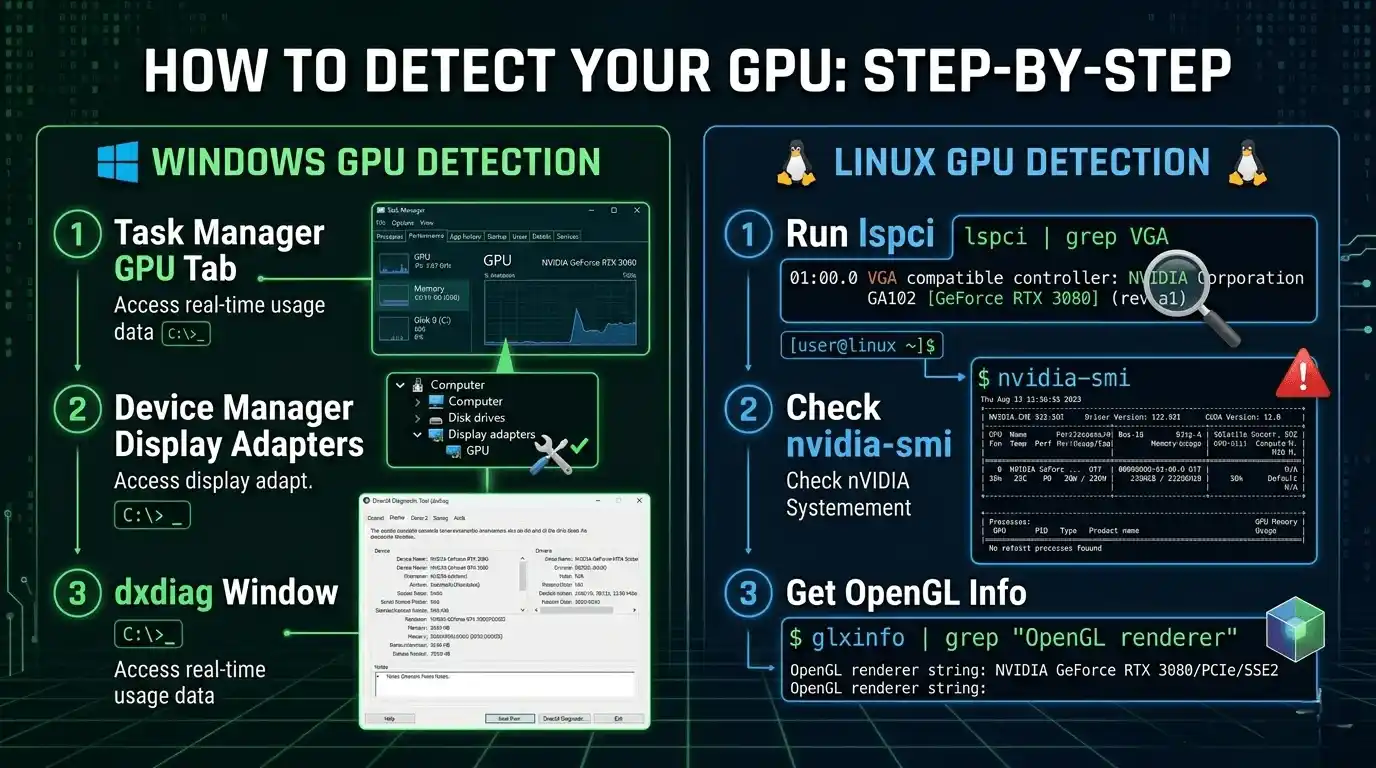
How to check what GPU you have (Windows 10 & 11)
The fastest way to identify your GPU is through built-in Windows tools.
Task Manager
- Press Ctrl + Shift + Esc
- Open the Performance tab
- Select GPU
You’ll see:
- GPU model
- VRAM amount
- Utilization percentage
- Temperature (on supported GPUs)
Device Manager
- Right-click Start
- Open Device Manager
- Expand Display Adapters
DirectX Diagnostic Tool (dxdiag)
- Press Win + R
- Type dxdiag
- Open the Display tab
This shows:
- GPU name
- Driver version
- VRAM
- DirectX support
GPU-Z for detailed specs
GPU-Z is one of the best lightweight GPU monitoring tools. It provides:
- PCIe lane speed
- Core clocks
- VRAM type
- Sensor monitoring
How to check your GPU on Ubuntu / Linux
Linux users can identify GPUs through terminal commands.
lspci | grep VGA
For NVIDIA GPUs:
nvidia-smi
For OpenGL renderer details:
glxinfo | grep “OpenGL renderer”
How to check if your PC even has a GPU
Some systems only use integrated graphics.
Integrated vs dedicated GPU
- Integrated GPU = built into CPU
- Dedicated GPU = separate graphics card with VRAM
Gaming laptops often switch dynamically between both.
How to check if GPU is working in BIOS
BIOS-level detection matters when:
- No display appears
- The PC fails to POST
- Drivers won’t install
Steps:
- Enter BIOS/UEFI
- Locate PCIe or graphics device section
- Confirm the GPU is detected
If the GPU does not appear in BIOS:
- Reseat the card
- Check PSU cables
- Try another PCIe slot
How to Check GPU Health
What is GPU health and why it matters
GPU health refers to:
- Thermal stability
- Clock consistency
- VRAM integrity
- Driver reliability
- Overall load behavior
A GPU may technically work while still suffering performance loss.
How to check GPU health on Windows 10 & 11
If your system shows inconsistent FPS drops, it may not just be GPU-related — network latency and system optimization can also affect gameplay smoothness, as explained in Does Internet Speed Affect FPS? FPS vs Ping Explained and Optimize Windows 11 for Gaming FPS Boost Settings (2025).
Task Manager GPU stats
Useful for:
- Utilization checks
- VRAM monitoring
- Temperature overview
Event Viewer
Look for:
- Display driver crashes
- TDR (Timeout Detection and Recovery) errors
GPU-Z Sensors Tab
Monitor:
- Temperature
- Fan speed
- Voltage
- Clock speed
MSI Afterburner
Excellent for:
- Real-time overlays
- FPS monitoring
- Thermal graphs
- Power limit tracking
How to check if GPU is working properly (no display scenarios)
If your GPU powers on but shows no display:
- Reseat the GPU
- Test another HDMI/DisplayPort cable
- Try another monitor
- Use integrated graphics to verify motherboard functionality
- Test the GPU in another PC
How to check GPU health on laptop
Laptop GPUs commonly thermal throttle because of compact cooling systems.
Use:
- HWiNFO64
- GPU-Z Portable
- MSI Afterburner
Watch for:
- Sudden clock drops
- Sustained temperatures above 90°C
- Reduced FPS after extended gaming sessions
Signs your GPU has a health problem
Common warning signs include:
- Visual artifacts
- Black screens
- Driver crashes
- Extremely high temperatures
- FPS instability
- VRAM-related crashes
- Low boost clocks
If these symptoms appear consistently, the GPU may require repair, repasting, or replacement.
How to Run a GPU Stress Test
What is a GPU stress test and when should you run one?
A GPU stress test pushes the graphics card to maximum load to expose:
- Overheating
- Instability
- VRAM errors
- Power delivery problems
Run stress tests after:
- Installing a new GPU
- Overclocking
- Rebuilding your PC
- Diagnosing crashes
Best GPU stress test tools (free)
| Tool | Primary Use | GPU Test | VRAM Test | Free? |
| FurMark | GPU stability / heat | ✅ | Partial | ✅ |
| MSI Kombustor | GPU stress + artifact check | ✅ | ✅ | ✅ |
| 3DMark (Basic) | GPU benchmark | ✅ | No | ✅ |
| OCCT | Full system + GPU | ✅ | ✅ | ✅ |
| Unigine Heaven | GPU benchmark + stress | ✅ | No | ✅ |
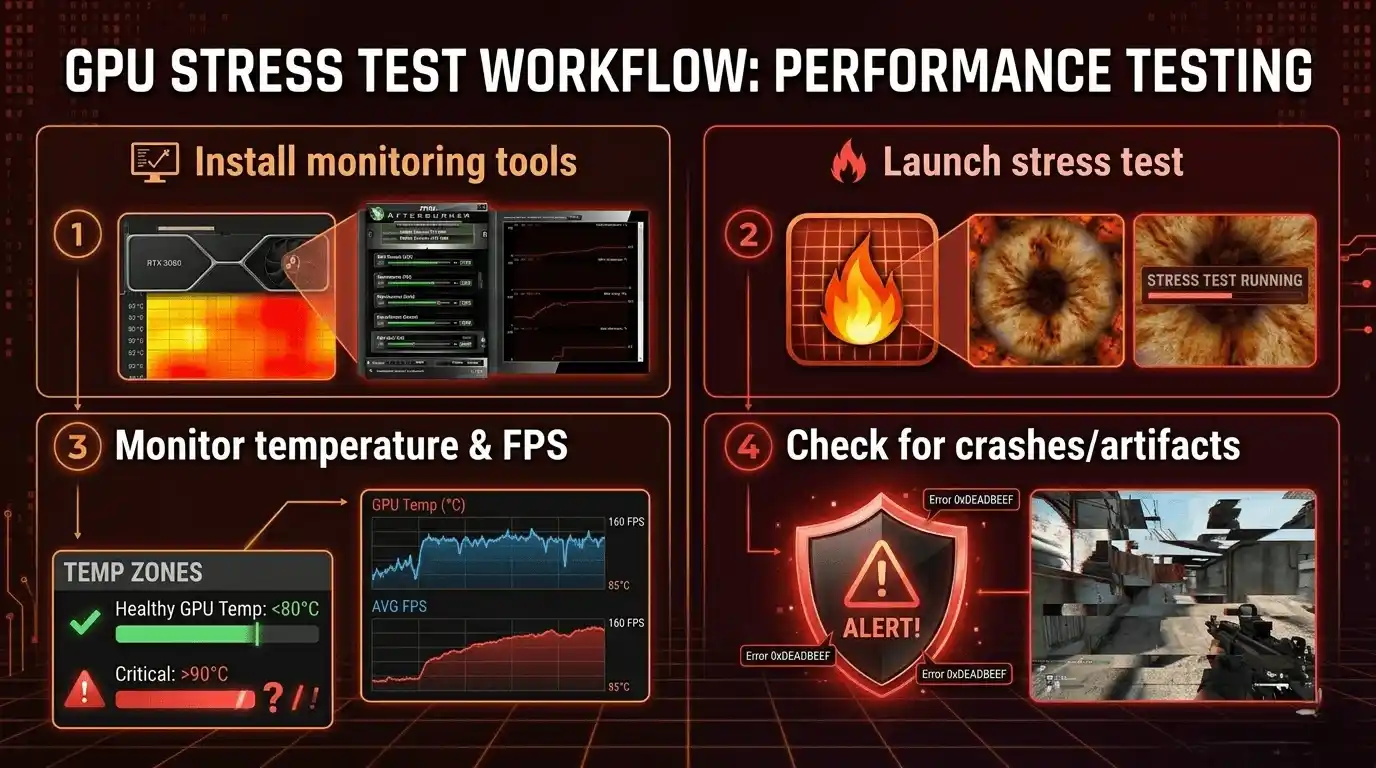
How to run a GPU stress test step by step
Step 1: Install monitoring software
Use:
- MSI Afterburner
- GPU-Z
- HWiNFO64
Step 2: Launch stress test software
FurMark and OCCT are the most aggressive options.
Step 3: Run the test for 15–30 minutes
Monitor:
- Temperature
- Clock speeds
- GPU usage
- Fan speed
Step 4: Watch for warning signs
Bad signs include:
- Artifacts
- Crashes
- Shutdowns
- Severe FPS drops
What are healthy GPU stress test results?
| Metric | Healthy Range | Warning Zone | Critical |
| GPU Temperature | < 80°C | 80–90°C | > 90°C |
| GPU Utilization | 95–100% | < 80% (throttling) | — |
| Core Clock | Near boost spec | 10–20% below spec | > 20% drop |
| VRAM Usage | Within capacity | Near limit | Overflow |
| Crashes / Artifacts | None | 1 minor | Any = fail |
How to Run a PC Stress Test (Full System — CPU + GPU)
Why run a full PC stress test (not just GPU)?
Sometimes the GPU is not the real issue.
A weak CPU, unstable PSU, or overheating VRM can reduce FPS dramatically.
Combined testing helps detect:
- CPU bottlenecks
- PSU instability
- Cooling problems
- Airflow limitations
Best tools to stress test PC (CPU + GPU combined)
| Tool | Purpose |
| OCCT | Full system stress testing |
| Prime95 + FurMark | Maximum thermal load |
| 3DMark | Balanced gaming simulation |
How to do a CPU stress test alongside GPU
Use HWiNFO64 to monitor:
- CPU temperatures
- GPU temperatures
- Clock speeds
- Power draw
Healthy CPU load temperatures:
- Desktop: under 85°C
- Laptop: under 90°C
How to Test GPU Performance with Benchmarks
If you’re comparing GPU performance before upgrading or buying a new system, you may also find our Is a Gaming PC Better Than PS5 FPS Comparison 2026 guide useful for understanding real-world performance differences.
What is a GPU benchmark?
A GPU benchmark is a repeatable workload that measures rendering performance.
Benchmark scores help you compare your GPU against:
- Identical models
- Factory specs
- Online databases
How to benchmark your GPU (step by step)
Recommended tools:
- 3DMark Fire Strike (1080p)
- 3DMark Time Spy (1440p/4K)
- Unigine Superposition
- In-game benchmark tools
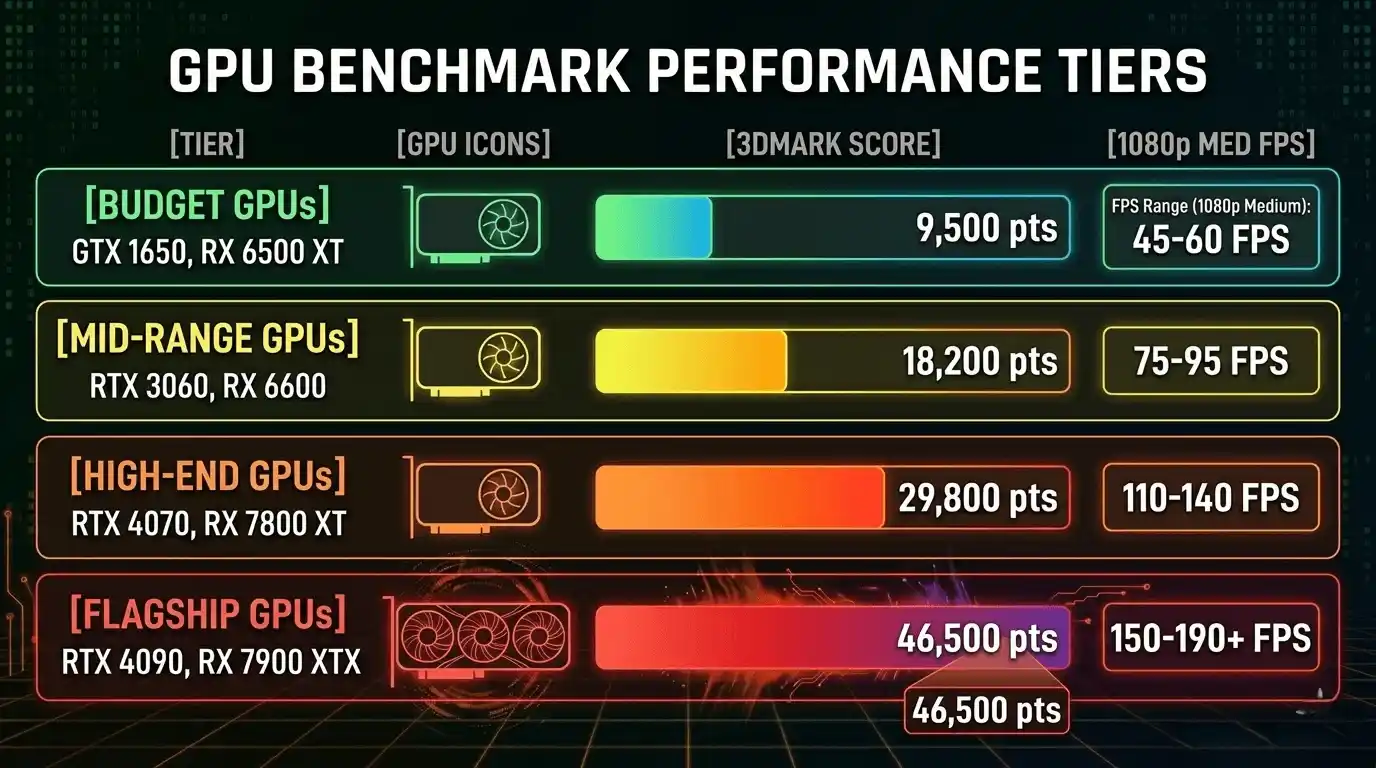
How to tell if your GPU benchmark score is good
| GPU Tier | Expected 3DMark Fire Strike Score | Typical 1080p FPS (Medium) |
| Budget (GTX 1650, RX 6500 XT) | 8,000–12,000 | 40–60 FPS |
| Mid-range (RTX 3060, RX 6600) | 15,000–20,000 | 60–100 FPS |
| High-end (RTX 4070, RX 7800 XT) | 22,000–30,000 | 100–144 FPS |
| Flagship (RTX 4090, RX 7900 XTX) | 35,000+ | 144–240 FPS |
You should also compare your results with:
- TechPowerUp
- UserBenchmark
- Reddit communities like r/hardware
🔧 FPS Calculator Tool Recommendation
Instead of manually estimating whether your benchmark score matches expected gaming performance, you can use the FPS Calculator for Low-End PC at Prime Games Arena. It calculates expected FPS based on your exact GPU and CPU combination, making it much easier to identify underperforming hardware before spending hours troubleshooting.
How to Check GPU Health and Performance on Windows 10 vs Windows 11
Windows 10 — GPU performance monitoring methods
Windows 10 includes:
- Task Manager GPU monitoring
- dxdiag
- Basic utilization tracking
For deeper monitoring, use:
- MSI Afterburner
- GPU-Z
Windows 11 — GPU performance monitoring methods
Windows 11 improves GPU monitoring with:
- Enhanced Task Manager engine graphs
- Xbox Game Bar performance overlay
- Better DirectStorage support
Press Win + G to open the Game Bar performance widget.
Can I Test My Graphics Card Without a Full PC?
How to test if a graphics card works without a full PC
You still need a minimal test setup:
- Motherboard
- CPU
- PSU
- RAM
- GPU
Important:
- Forgetting 6-pin or 8-pin GPU power connectors prevents POST
- Integrated graphics can help isolate GPU issues
Common GPU Performance Problems and Fixes
GPU not performing at expected FPS or benchmark scores
Possible causes:
- CPU bottleneck
- Thermal throttling
- Power limits
- PCIe slot bandwidth restrictions
Fixes:
- Clean the GPU cooler
- Reapply thermal paste
- Update drivers
- Ensure PCIe x16 operation
GPU stress test fails (crash, artifact, shutdown)
Possible causes:
- Overheating
- VRAM instability
- Unstable overclock
- Weak PSU
Recommended fixes:
- Reset clocks to stock
- Improve airflow
- Run VRAM tests in OCCT
- Verify PSU wattage
GPU detected but no display output
Try:
- Reseating the GPU
- Another PCIe slot
- Another monitor or cable
- DDU driver reinstall
- Testing the GPU in another PC
Calculate Your Exact FPS with the FPS Calculator for Low-End PC
If you want to know whether your GPU is actually delivering the FPS it should, the FPS Calculator for Low-End PC can help. The tool estimates expected gaming performance using your exact GPU and CPU combination, helping you compare real-world FPS against benchmark expectations.
This is especially useful for:
- Budget gaming PCs
- Older GPUs
- Laptop gaming systems
- Diagnosing FPS underperformance
Instead of guessing whether your RTX 3060 or GTX 1650 is behaving normally, you can quickly compare expected and actual frame rates across different games and settings.
👉 Try the FPS Calculator for Low-End PC here: FPS Calculator for Low-End PC
Conclusion: Is Your GPU Performing Well?
Checking GPU health is about more than just seeing if games launch. A properly performing graphics card should maintain stable FPS, safe temperatures, healthy clock speeds, and reliable benchmark results under load.
Use GPU-Z and MSI Afterburner for monitoring, run FurMark or OCCT for stress testing, and compare your benchmark scores against GPUs in the same performance tier. If your FPS is lower than expected, investigate thermals, drivers, CPU bottlenecks, and PCIe bandwidth limitations.
Finally, tools like the FPS Calculator for Low-End PC make it easier to determine whether your GPU is actually performing at its expected level — helping you troubleshoot smarter and optimize your gaming experience faster.


One Response